PhD research:
Variability in Multistable Apparent Motion Perception
Fascinated by the question "Why do we see the world the way we see it?", I started my carreer with research in vision science. For the studies in my phd, ambiguous stimuli were used. An ambiguous stimulus is a visual that can be perceived in two or more different ways, even though it physically remains the same. The phenomenon where different people, or one person from one moment to the next, experience different percepts of one and the same stimulus, is called 'multistable perception'. By studying multistable perception, scientists are able to focus on the mental processes governing visual perception, excluding any effects that may be caused by a change in the external circumstances (the visual or stimulus). Below on this page are a few data visualizations from some of the studies carried out in this phd. The research is very specific to the field of vision science, so it is not the most generally relevant read. However, if you are curious, you can consult the full thesis here.
Motion Quartet study
The plots above are from a study in my PhD where observers were shown the ambiguous 'motion quartet' stimulus many times in a row. You can perceive the dots of a 'motion quartet' stimulus moving either horizontally or vertically. Observers were continuously asked to indicate which percept they had. The plots above show that individuals can vary substantially, not only in what they perceive, but also in how much their perceptions change over time.
EEG study

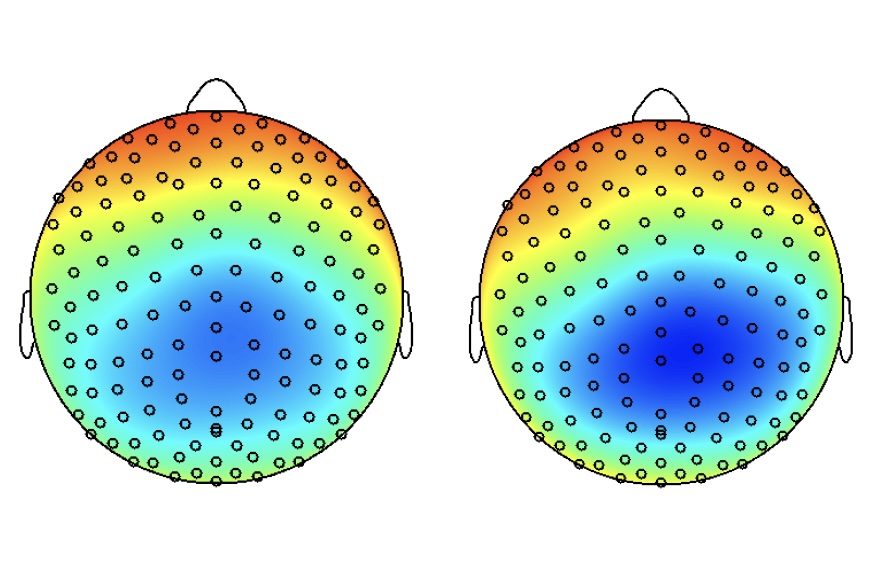
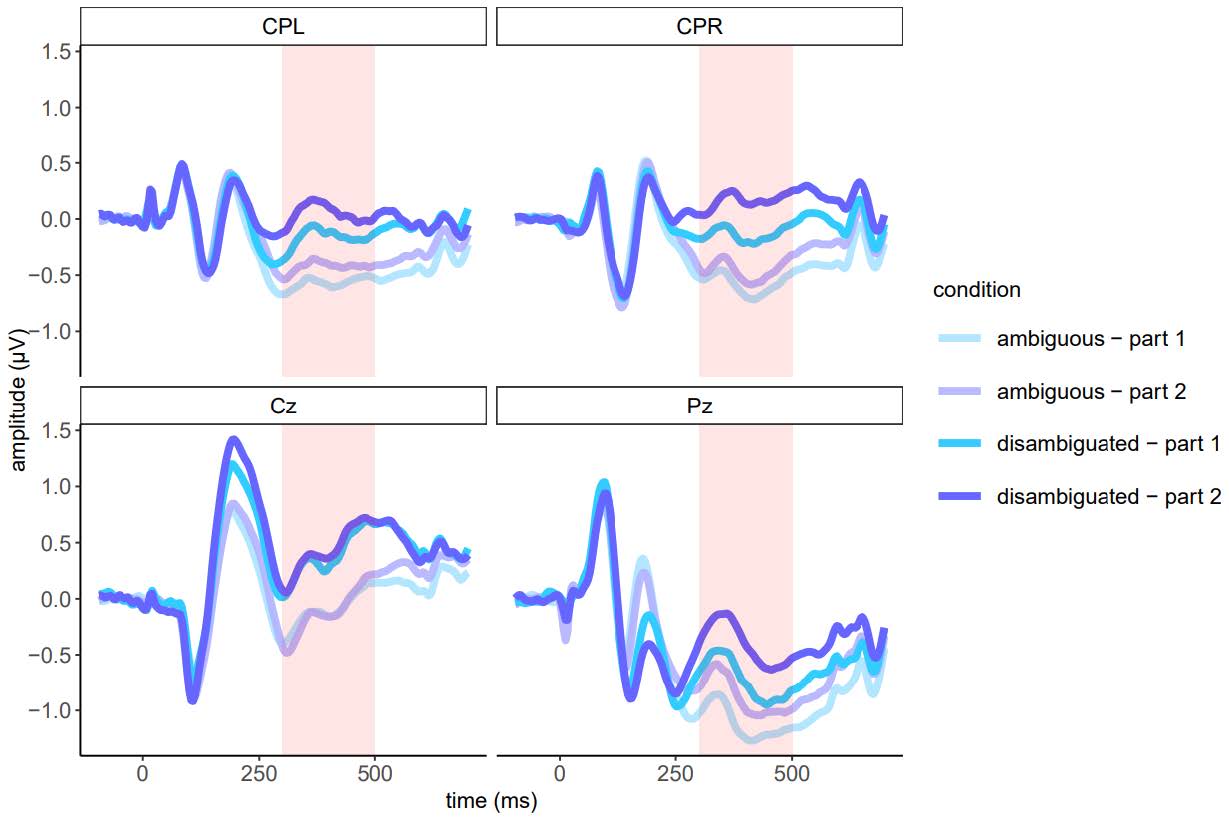
The visualizations above all depict different aspects of the same data from an electro-encephalography (EEG) study in my PhD research.
EEG records electrical signals by means of electrodes on the scalp, indirectly measuring underlying neural activity in the brain.
The output is a complex set of big data, looking like waves with certain amplitudes and frequencies for each electrode. The data provides information on different aspects of brain functioning after preprocessing and analysis.
The details of the study are irrelevant here, but the visualizations show that the exact same set of data can provide vastly different information, depending on how you decide to plot it.
The use of relevant and correct data visualizations for the questions at hand can determine whether a visualization is either powerful or misleading.
Data Visualization for Enabel Uganda
As a junior expert in data analysis and visualization for Enabel (the Belgian development agency) in Uganda, I was responsible for data visualization of the country portfolio and capacity building. The projects of Enabel in Uganda are mostly related to education, health and employment. In order to map the expected outcomes, monitor planned activities, and evaluate the potential impact, I co-created various forms of data visualization with the project teams.